
01
Methodology diagram
A left-to-right architecture that makes inputs, modules, data movement, and output hierarchy easy to scan.
 Paper Banana.me
Research figures · editable data charts · revision-first workflow
Turn a method section, dataset, or rough sketch into a figure that is easier to inspect, revise, and explain. Start free—no credit card required.
Strictly Prohibits Adult/NSFW ContentYour image will appear here
Structured brief before generation · Exact credit cost before every run · SVG charts rendered from your values · Confirmed failures refund
methodology diagrams
system architectures
graphical abstracts
statistical charts
sketch refinement
Begin with the scientific message, not the decoration. Paper Banana separates brief construction from generation so you can catch missing labels and structural mistakes earlier.
Paper Banana prepares the prompt; you review it before generation.
Image generation is useful for composition, but it should not be trusted to redraw data. Paste CSV here to make a deterministic, accessible chart and download every element as editable SVG.
Each example below was designed for this site. Open its working prompt, replace the scientific content, and keep the structural constraints that matter.
A left-to-right architecture that makes inputs, modules, data movement, and output hierarchy easy to scan.
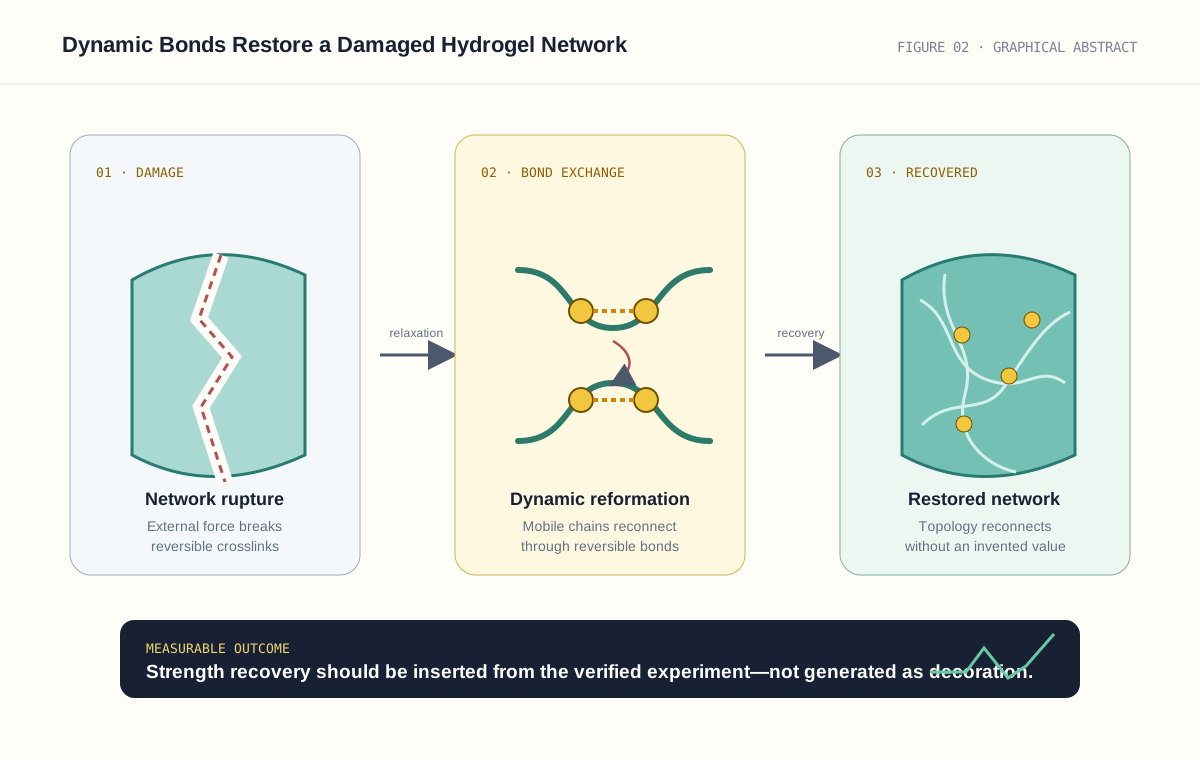
A compact graphical abstract with a macro process, a mechanistic inset, and one measurable outcome.
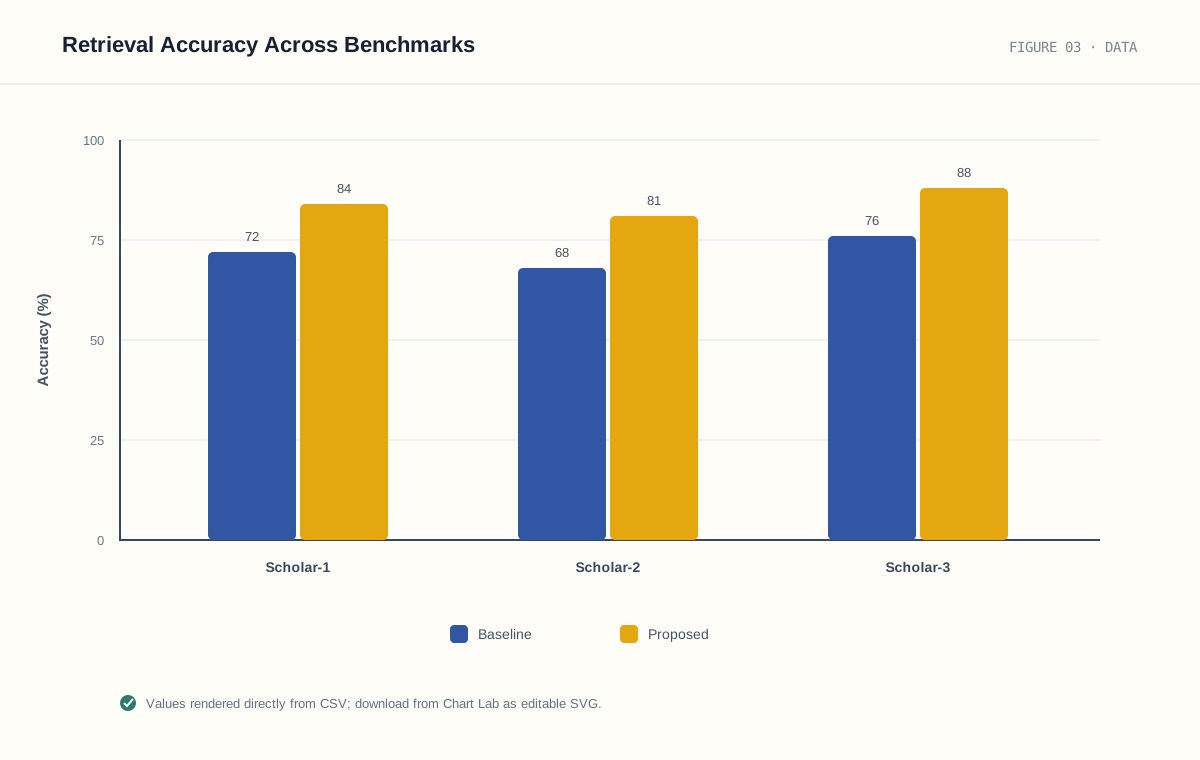
A restrained chart with accessible colors, labeled axes, and a caption-ready legend. Recreate it with your values in Chart Lab.
Make modules, data flow, hierarchy, and feedback loops readable without tracing a maze of arrows.
Turn an implementation description into an organized figure with exact component labels and clear boundaries.
Compress context, intervention, mechanism, and outcome into one deliberate scan path.
Explain physical, biological, or chemical processes with a controlled visual hierarchy and concise annotations.
Render supplied values as editable SVG bars or lines instead of asking an image model to reproduce numbers.
Upload a sketch, freeze its topology and labels, then improve alignment, spacing, color, and typography.
Use a visual model when the job is layout, hierarchy, icons, or scientific storytelling. Use Chart Lab when a bar height, axis, or value must be exact. Paper Banana makes that boundary visible instead of treating every figure as a picture.
The original PaperBanana paper describes a reference-driven, five-stage framework for automated academic illustration. This independent workspace does not claim to reproduce that architecture; it turns the same user need into a practical brief, generation, chart, and review flow.
Finds relevant visual references.
Turns scientific context into structure.
Applies an academic visual language.
Renders the proposed figure.
Checks faithfulness and readability.
Looking for the research itself? Read the PaperBanana paper on arXiv or inspect the open-source project on GitHub.
Write the one conclusion a reader should understand before they read the caption.
List exact labels, reading order, modules, arrows, and relationships that must not change.
Use image generation for illustrative composition; use deterministic SVG for numerical plots.
Check scientific faithfulness, spelling, color accessibility, and caption alignment before publishing.
One high-fidelity default figure uses 5 credits. A faster draft can use fewer. You see the exact cost before generation, credits roll over, and one-time packs never start a subscription.
Build a complete brief and generate one high-fidelity figure.
A full year of individual figure work at the lowest plan price.
Year-round capacity for an active project or small group.
High-volume annual capacity with adjustable quantity.
Capacity uses the lowest-cost live setup for this site. Your exact credit cost changes with the selected model and settings and is shown before generation.
Clear answers about inputs, accuracy, editing, formats, credits, and the human review that every academic figure still needs.
Paper Banana is an academic figure workspace for turning research text, data, and rough visual ideas into methodology diagrams, scientific illustrations, graphical abstracts, and editable charts. This site is an independent product and is not the official website of the research authors.
Yes. Paste the relevant method context into the Brief Builder, specify the figure message, reading order, and required labels, then send the structured prompt to the live image generator.
Use Chart Lab for numerical figures. It parses the CSV values in your browser, renders bars or lines deterministically, and exports editable SVG. Image generation remains available for non-numerical illustrations.
Yes. Choose an image-to-image model in the figure studio, upload your draft, and describe what to improve. State what must remain unchanged, then verify every label and connection in the result.
Generated image formats depend on the selected model and result endpoint. Chart Lab always exports a fully editable SVG that can be opened in Figma, Illustrator, Inkscape, PowerPoint, or a text editor.
A new account receives five welcome credits, enough for one high-fidelity default generation. Brief Builder, prompt templates, and Chart Lab can be used without spending generation credits.
Subscription and one-time credits remain on your account while it is active. One-time packs do not start a subscription. You can see the exact credit charge before every generation.
No. Treat every generated figure as a draft. Verify scientific meaning, topology, numerical claims, spelling, labels, accessibility, and publisher requirements with a human reviewer before submission.
Build the brief for free, inspect the prompt, and generate only when the structure is ready.